Actuary Salary in Merrimack, NH: $116,875 (2026)
Quick Answer:A full-time actuary in Merrimack, NH earns a median $116,875/year (≈ $56.19/hour) in nominal terms for 2026 — projected from BLS OEWS 2025 (SOC 15-2011). Once you factor in Merrimack's price level (7% above national, BEA RPP 107.3), that paycheck buys what $108,924 would nationally. Nominal pay sits 2.5% below the New Hampshire state average.
Based on BLS state-level estimates · View source
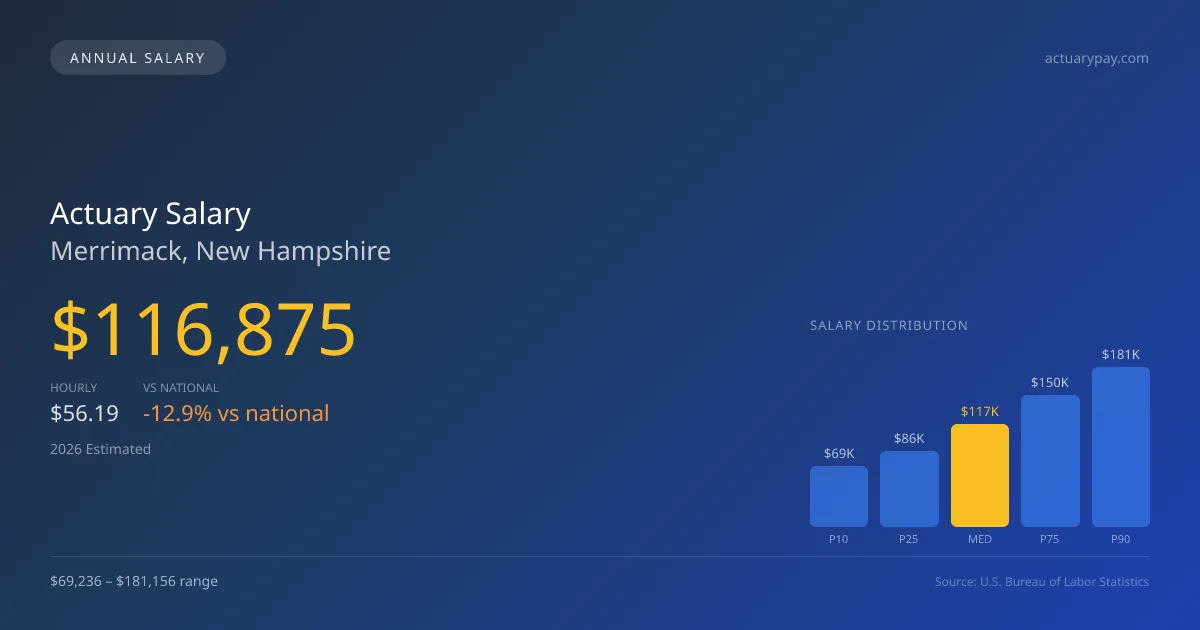
In 2026, the average actuary salary in Merrimack, New Hampshire, is anticipated to reach $116,875. The salary spectrum ranges from a low of $69,236 for the bottom 10% to an upper limit of $181,156 for the top 90%. These figures, derived from 2025 BLS OEWS data projected to 2026, reflect local economic conditions including cost of living adjustments in Merrimack. While these earnings represent a competitive market, they fall below the national average of $134,160, indicating that the local demand for actuaries may vary by specialty. Specifically, actuaries in life, health, and pension sectors (SOA) often encounter different compensation dynamics compared to those in property and casualty (CAS) roles.
About the Merrimack Market
Salary estimated from New Hampshire average ($120,000) adjusted for local cost of living.
Salary Breakdown
| Percentile | Annual | Hourly |
|---|---|---|
| Entry Level (P10) | $69,236 | $33.28 |
| Lower Range (P25) | $85,720 | $41.21 |
| Median (P50)(typical) | $116,875 | $56.19 |
| Upper Range (P75) | $149,600 | $71.92 |
| Top Earners (P90) | $181,156 | $87.09 |
Median Salary Position
12.88% below the national average
2026 Salary Percentile Distribution in Merrimack
In Merrimack, NH, the actuary salary spread from the 10th to 90th percentile is $111,920 (2026 est.). At $116,875, the local median is 12.88% below the national median of $134,160.
Salary Calculator
At 40 hours/week in Merrimack: You'd be in the lower-middle range
How Merrimack Actuary Pay Compares
Merrimack median: $116,875/year (2026)
| Compared To | Median Salary | Merrimack Pays |
|---|---|---|
| New Hampshire Average | $119,872 | -2.50% less |
| National Average | $134,160 | -12.88% less |
Actuarys in Merrimack, NH earn a median of $116,875 per year (2026 est.), which is 12.88% lower than the national median of $134,160 and 2.50% below the New Hampshire state average of $119,872.
Cost-of-Living Adjusted Salary
Merrimack has a cost of living 7.30% above the national average.
Adjusted salary = nominal × (100 / CoL index). CoL index: 100 = national average.
Merrimack, NH has a cost-of-living index of 107.3 (above the national average of 100). While the nominal salary of $116,875 is competitive, the higher cost of living reduces purchasing power to an effective $108,924 — a 6.8% reduction.
Compare Purchasing Power
Select a city to see how your salary compares after cost of living
Select a city above to compare purchasing power
2019 BLS Actual
$94,390
2025 BLS Actual
$113,251
2026 Current Est.
$116,875
2019–2027 Growth
+27.8%
Salary Trajectory for Actuaries in Merrimack (2019–2027)
2019–2025: actual BLS OEWS data for this metro area. 2026+: CAGR 3.20% projection.
| Year | Annual Salary | Status |
|---|---|---|
| 2019 | $94,390 | Actual |
| 2020 | $96,725 | Actual |
| 2021 | $92,256 | Actual |
| 2022 | $99,304 | Actual |
| 2023 | $104,539 | Actual |
| 2024 | $125,492 | Actual |
| 2025 | $113,251 | Actual |
| 2026(current) | $116,875 | Estimated |
| 2027 | $120,615 | Projected |
Based on 7 years of BLS OEWS data for the Merrimack metropolitan area, the median actuary salary grew 20.0% from $94,390 (2019) to $113,251 (2025). At a 3.20% compound annual growth rate, salaries are projected to reach $120,615 by 2027 — a total increase of $26,225 (27.78%) from 2019.
Note: Historical values (2019–2025) are actual BLS OEWS figures for the Merrimack metropolitan area, sourced from annual Occupational Employment and Wage Statistics surveys. 2026–2026 figures are current estimates, and 2027 values are projections, calculated using a 3.20% CAGR derived from 7-year BLS historical data. Actual salaries may vary based on employer, experience, certifications, and local market conditions.
Salary by Experience Level
| Experience | Estimated Salary Range |
|---|---|
| 0-2 years (New Graduate) | $69,236 – $85,720 |
| 3-5 years (Mid Career) | $85,720 – $116,875 |
| 5+ years (Experienced) | $116,875 – $149,600 |
| 10+ years (Top Earner) | $149,600 – $181,156 |
ASA, FSA salary ranges estimated from BLS percentile data. Individual actuary compensation varies by employer, certifications, and specialization.
Actuary Job Market in Merrimack
The job market for actuaries in Merrimack is currently modest, with only five professionals employed in the area. Given the cost of living index of 107.3, this could impact take-home pay, with local salaries needing to stretch further than they might in areas with lower living expenses. Large employers in Merrimack, such as Prudential and UnitedHealth, generally offer the most competitive packages for actuaries, especially those who achieve fellow status, as the progression from ASA to FSA can significantly boost earnings. The disparity between the lower and upper salary limits is largely influenced by exam progression—each passed exam typically correlates with a pay increase—and specialized skills in data analytics and predictive modeling are highly desired in consulting roles. For those in Merrimack looking to optimize salaries, pursuing additional qualifications and networking within local firms can enhance their career trajectory.
More salary data for Merrimack, NH:
Frequently Asked Questions
How much do actuaries make in Merrimack, NH in 2026?
Is Merrimack, NH a good place to work as a actuary?
Can actuaries make $100K in Merrimack?
What is the cost-of-living adjusted actuary salary in Merrimack?
How much does a actuary make per hour in Merrimack?
Related Pages
Compare Salaries
Career Resources
Nearby Cities in New Hampshire
Written by Maria Chen, FSA, MAAA
Career Analyst
Maria has 10 years of experience in life insurance. She specializes in risk assessment and pricing strategies.
Methodology & Data Source
Salary figures on this page are 2026 projections based on the Bureau of Labor Statistics Occupational Employment and Wage Statistics (OEWS) survey, May 2026 release. The BLS reported a median annual salary of $113,251 for actuariesin the Merrimack metropolitan area. A 3.20% compound annual growth rate (CAGR), calculated from 6-year national BLS wage trends, was applied to project current 2026 compensation. Percentile ranges (P10–P90) represent the full salary distribution across experience levels and practice settings in this market.
Data Sources & Methodology
Salary data for Merrimack is estimated from official BLS state-level occupational wage data (2025), adjusted for regional cost-of-living differences using BEA RPP (Regional Price Parities).
2026 figures are projected from 2025 BLS data using a compound annual growth rate (CAGR) of 3.20%, derived from historical BLS wage trends for actuarys (SOC 15-2011).
Compiled and verified by Maria Chen, FSA, MAAA, a licensed actuary with 10+ years of clinical experience. · View source data at BLS.gov