Actuary Salary in New Hampshire: $116,821 (2026)
Quick Answer:Across New Hampshire's 16 metropolitan areas, the average median actuary pay sits at $116,821/year heading into 2026 — a figure projected from 2025 BLS OEWS wage data for SOC 15-2011. Because New Hampshire sits at BEA RPP 107.3 (7% above the U.S. baseline), that statewide median translates to roughly $108,873 in nationally-comparable purchasing power. Highest-paying metros: Manchester ($116,127), Nashua ($115,852), Salem ($113,395).
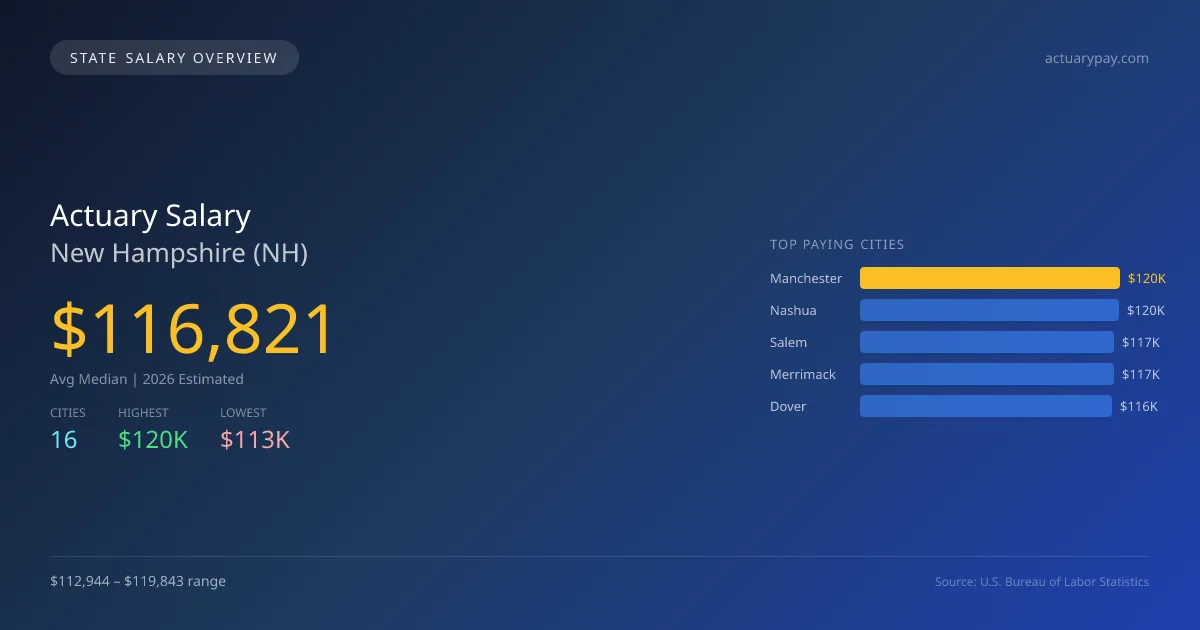
In New Hampshire, the average median salary for actuaries in 2026 is projected to be $116,821, which falls below the national median of $134,160 by 12.9%. The highest paying city in the state is Manchester, offering a salary of $119,843, while Bedford has the lowest at $112,944, creating a salary gap of $6,899 between these locations. Differences in pay can be attributed to various factors, including the size and industry focus of local firms and cost of living variations. New Hampshire has specific state licensing requirements and scope of practice laws, which can influence the demand for actuaries. As the insurance and financial sectors continue to expand, the role of actuaries remains critical, contributing to a projected annual growth rate of 3.20% in employment opportunities from 2025. The top cities projected for 2026 show that Nashua follows closely behind Manchester at $119,559, and Salem, Merrimack, and Dover offer salaries of $117,024, $116,875, and $115,953, respectively. The overall job market in the state shows promising strength for actuaries, supported by ongoing demand in related sectors.
New Hampshire Actuary Salary Range
Overall salary range in New Hampshire: $68,136 (lowest entry-level) to $185,757 (highest top earner)
New Hampshire vs National Average
New Hampshire actuaries earn 12.92% less than the national median ($-17,339/year difference).
New Hampshire Actuary Salary Distribution (2026)
Actuary salaries in New Hampshire range from $72,368 (entry-level, 10th percentile) to $180,603 (top earners, 90th percentile), with a median of $116,821. The New Hampshire median is $17,339 below the US national median of $134,160. The average hourly rate is $56.16/hr. Approximately 132 actuarys are employed across 16 cities.
2019 BLS Actual
$94,347
2025 BLS Actual
$113,199
2026 Current Est.
$116,821
2019–2027 Growth
+27.8%
Salary Trajectory for Actuaries in New Hampshire (2019–2027)
2019–2025: actual BLS OEWS data for this metro area. 2026+: CAGR 3.20% projection.
| Year | Annual Salary | Status |
|---|---|---|
| 2019 | $94,347 | Actual |
| 2020 | $96,681 | Actual |
| 2021 | $92,214 | Actual |
| 2022 | $99,258 | Actual |
| 2023 | $104,491 | Actual |
| 2024 | $125,435 | Actual |
| 2025 | $113,199 | Actual |
| 2026(current) | $116,821 | Estimated |
| 2027 | $120,560 | Projected |
Based on 7 years of BLS OEWS data for the New Hampshire metropolitan area, the median actuary salary grew 20.0% from $94,347 (2019) to $113,199 (2025). At a 3.20% compound annual growth rate, salaries are projected to reach $120,560 by 2027 — a total increase of $26,213 (27.78%) from 2019.
Note: Historical values (2019–2025) are actual BLS OEWS figures for the New Hampshire metropolitan area, sourced from annual Occupational Employment and Wage Statistics surveys. 2026–2026 figures are current estimates, and 2027 values are projections, calculated using a 3.20% CAGR derived from 7-year BLS historical data. Actual salaries may vary based on employer, experience, certifications, and local market conditions.
Top 5 Highest Paying Cities in New Hampshire
Lowest Paying Cities in New Hampshire
Best Value Cities for Actuaries in New Hampshire
When adjusted for local cost of living, these New Hampshire cities offer the most purchasing power for actuaries.
| City | Nominal Salary | CoL Index | Adjusted Salary |
|---|---|---|---|
| Manchester | $119,843 | 107.3 | $111,690 |
| Nashua | $119,559 | 107.3 | $111,425 |
| Salem | $117,024 | 107.3 | $109,062 |
| Merrimack | $116,875 | 107.3 | $108,924 |
| Dover | $115,953 | 107.3 | $108,064 |
Adjusted salary = nominal salary × (100 / CoL index). CoL index: 100 = national average. Lower index = lower cost of living.
Salary by Experience Level in New Hampshire
| Experience Level | Estimated Annual |
|---|---|
| Entry Level (0-2 years) | $72,368 |
| Mid Career (3-7 years) | $116,821 |
| Experienced (7+ years) | $180,603 |
Estimates based on BLS percentile data averaged across New Hampshire metro areas. Individual pay varies by employer, certifications, and specialization.
All 16 Cities in New Hampshire
More New Hampshire Salary Data
Explore More Actuary Salary Data
Frequently Asked Questions
How much do actuaries make in New Hampshire in 2026?
What is the highest paying city for actuaries in New Hampshire?
How does New Hampshire actuary pay compare to the national average?
What is the entry-level actuary salary in New Hampshire?
How many actuaries are employed in New Hampshire?
Which New Hampshire city offers the best value for actuaries?
Written by Maria Chen, FSA, MAAA
Career Analyst
Maria has 10 years of experience in life insurance. She specializes in risk assessment and pricing strategies.
Methodology & Data Source
Statewide salary figures on this page are 2026 projections based on the Bureau of Labor Statistics Occupational Employment and Wage Statistics (OEWS) survey, May 2026 release. A 3.20% compound annual growth rate (CAGR), derived from 6-year national BLS wage trends, was applied to each metro area's reported salary to estimate current 2026 actuary compensation across New Hampshire. State averages are employment-weighted across 16 metro areas — larger metro areas with more actuariescontribute proportionally more to the average, producing figures that better reflect typical compensation. Individual pay varies by city, employer, certifications, and experience.
Data Sources & Methodology
Source: BLS, OEWS, 2-year dataset (–). Per-city data from annual BLS metropolitan area surveys.
2026 figures are projected from 2025 BLS data using a compound annual growth rate (CAGR) of 3.20%, derived from historical BLS wage trends for actuarys (SOC 15-2011).
Compiled and verified by Maria Chen, FSA, MAAA, a licensed actuary with 10+ years of clinical experience. · View source data at BLS.gov