Actuary Salary in Cranston, RI: $131,887 (2026)
Quick Answer:A full-time actuary in Cranston, RI earns a median $131,887/year (≈ $63.41/hour) in nominal terms for 2026 — projected from BLS OEWS 2025 (SOC 15-2011). Once you factor in Cranston's price level (1% above national, BEA RPP 100.5), that paycheck buys what $131,231 would nationally. Nominal pay sits 2.2% below the Rhode Island state average.
Based on BLS state-level estimates · View source
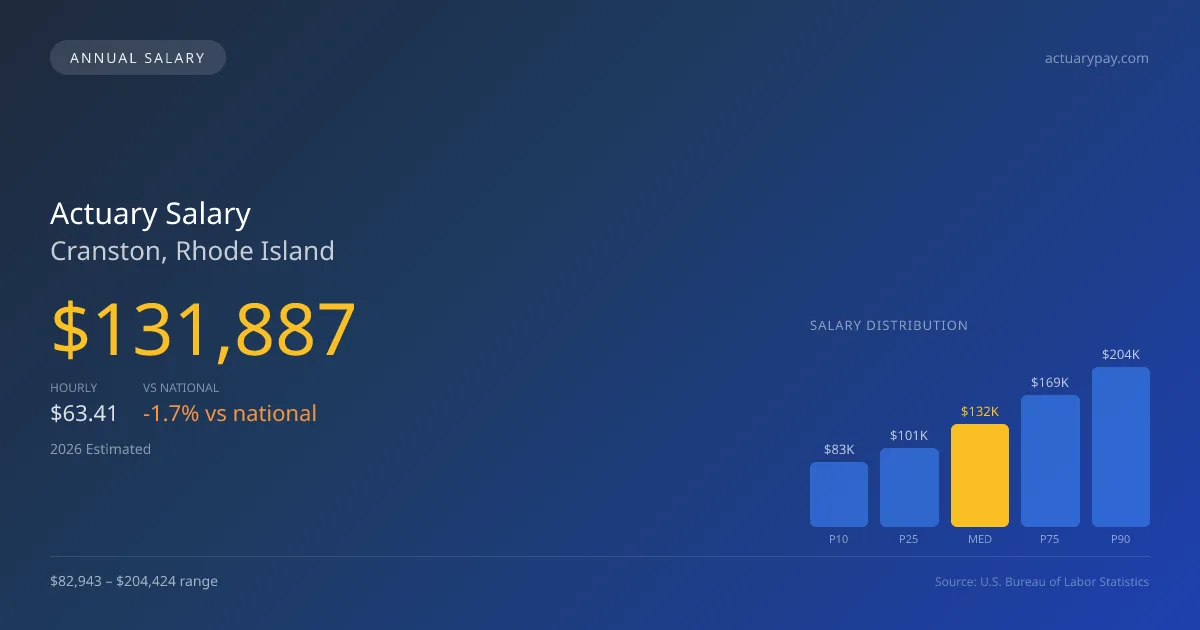
In 2026, actuary salaries in Cranston, Rhode Island, present a competitive outlook, with a median annual figure of $131,887. The salary range extends from $82,943 at the 10th percentile to $204,424 at the 90th percentile, reflecting a diverse market that can cater to various levels of expertise among actuaries. These projections are derived from 2025 BLS data, adjusted for local cost-of-living considerations in Cranston, which operates slightly above the national average (CoL index: 100.5). As actuaries in the region weigh their specialty options between the Society of Actuaries (SOA) and the Casualty Actuarial Society (CAS), understanding local employer dynamics, especially those in sectors like life and health versus property and casualty, becomes critical for career and compensation planning.
About the Cranston Market
Salary estimated from Rhode Island average ($120,000) adjusted for local cost of living.
Salary Breakdown
| Percentile | Annual | Hourly |
|---|---|---|
| Entry Level (P10) | $82,943 | $39.88 |
| Lower Range (P25) | $100,534 | $48.34 |
| Median (P50)(typical) | $131,887 | $63.41 |
| Upper Range (P75) | $168,815 | $81.16 |
| Top Earners (P90) | $204,424 | $98.28 |
Median Salary Position
1.69% below the national average
2026 Salary Percentile Distribution in Cranston
In Cranston, RI, the actuary salary spread from the 10th to 90th percentile is $121,481 (2026 est.). At $131,887, the local median is 1.69% below the national median of $134,160.
Salary Calculator
At 40 hours/week in Cranston: You'd be in the lower-middle range
How Cranston Actuary Pay Compares
Cranston median: $131,887/year (2026)
| Compared To | Median Salary | Cranston Pays |
|---|---|---|
| Rhode Island Average | $134,853 | -2.20% less |
| National Average | $134,160 | -1.69% less |
Actuarys in Cranston, RI earn a median of $131,887 per year (2026 est.), which is 1.69% lower than the national median of $134,160 and 2.20% below the Rhode Island state average of $134,853.
Cost-of-Living Adjusted Salary
Cranston has a cost of living 0.50% above the national average.
Adjusted salary = nominal × (100 / CoL index). CoL index: 100 = national average.
Cranston, RI has a cost-of-living index of 100.5 (above the national average of 100). While the nominal salary of $131,887 is competitive, the higher cost of living reduces purchasing power to an effective $131,231 — a 0.5% reduction.
Compare Purchasing Power
Select a city to see how your salary compares after cost of living
Select a city above to compare purchasing power
2019 BLS Actual
$106,514
2025 BLS Actual
$127,797
2026 Current Est.
$131,887
2019–2027 Growth
+27.8%
Salary Trajectory for Actuaries in Cranston (2019–2027)
2019–2025: actual BLS OEWS data for this metro area. 2026+: CAGR 3.20% projection.
| Year | Annual Salary | Status |
|---|---|---|
| 2019 | $106,514 | Actual |
| 2020 | $109,148 | Actual |
| 2021 | $104,105 | Actual |
| 2022 | $112,058 | Actual |
| 2023 | $117,966 | Actual |
| 2024 | $117,966 | Actual |
| 2025 | $127,797 | Actual |
| 2026(current) | $131,887 | Estimated |
| 2027 | $136,107 | Projected |
Based on 7 years of BLS OEWS data for the Cranston metropolitan area, the median actuary salary grew 20.0% from $106,514 (2019) to $127,797 (2025). At a 3.20% compound annual growth rate, salaries are projected to reach $136,107 by 2027 — a total increase of $29,593 (27.78%) from 2019.
Note: Historical values (2019–2025) are actual BLS OEWS figures for the Cranston metropolitan area, sourced from annual Occupational Employment and Wage Statistics surveys. 2026–2026 figures are current estimates, and 2027 values are projections, calculated using a 3.20% CAGR derived from 7-year BLS historical data. Actual salaries may vary based on employer, experience, certifications, and local market conditions.
Salary by Experience Level
| Experience | Estimated Salary Range |
|---|---|
| 0-2 years (New Graduate) | $82,943 – $100,534 |
| 3-5 years (Mid Career) | $100,534 – $131,887 |
| 5+ years (Experienced) | $131,887 – $168,815 |
| 10+ years (Top Earner) | $168,815 – $204,424 |
ASA, FSA salary ranges estimated from BLS percentile data. Individual actuary compensation varies by employer, certifications, and specialization.
Actuary Job Market in Cranston
The Cranston job market currently only employs about 12 actuaries, indicating a limited pool that may offer numerous opportunities for those well-positioned with credentials. While the cost of living is slightly elevated, this can affect take-home pay, and actuaries are encouraged to explore positions within leading firms such as Prudential, MetLife, and UnitedHealth, which are known for higher remuneration. The variance in salaries is significantly influenced by factors such as exam progression, where each passed exam can yield substantial pay increases, and specialization—consulting roles in P&C can offer premiums compared to other areas. For candidates aspiring to maximize their actuary pay in Cranston, pursuing advanced credentials and engaging in continuous professional development can be advantageous, particularly as firms increasingly value predictive analytics in their actuarial practices.
More salary data for Cranston, RI:
Frequently Asked Questions
How much do actuaries make in Cranston, RI in 2026?
Is Cranston, RI a good place to work as a actuary?
Can actuaries make $100K in Cranston?
What is the cost-of-living adjusted actuary salary in Cranston?
How much does a actuary make per hour in Cranston?
Related Pages
Compare Salaries
Career Resources
Nearby Cities in Rhode Island
Written by Maria Chen, FSA, MAAA
Career Analyst
Maria has 10 years of experience in life insurance. She specializes in risk assessment and pricing strategies.
Methodology & Data Source
Salary figures on this page are 2026 projections based on the Bureau of Labor Statistics Occupational Employment and Wage Statistics (OEWS) survey, May 2026 release. The BLS reported a median annual salary of $127,797 for actuariesin the Cranston metropolitan area. A 3.20% compound annual growth rate (CAGR), calculated from 6-year national BLS wage trends, was applied to project current 2026 compensation. Percentile ranges (P10–P90) represent the full salary distribution across experience levels and practice settings in this market.
Data Sources & Methodology
Salary data for Cranston is estimated from official BLS state-level occupational wage data (2025), adjusted for regional cost-of-living differences using BEA RPP (Regional Price Parities).
2026 figures are projected from 2025 BLS data using a compound annual growth rate (CAGR) of 3.20%, derived from historical BLS wage trends for actuarys (SOC 15-2011).
Compiled and verified by Maria Chen, FSA, MAAA, a licensed actuary with 10+ years of clinical experience. · View source data at BLS.gov