Actuary Salary in Bellingham, WA: $143,965 (2026)
Quick Answer:A full-time actuary in Bellingham, WA earns a median $143,965/year (≈ $69.22/hour) in nominal terms for 2026 — projected from BLS OEWS 2025 (SOC 15-2011). Once you factor in Bellingham's price level (7% above national, BEA RPP 107.4), that paycheck buys what $134,046 would nationally. Nominal pay sits 0.1% below the Washington state average.
Based on BLS state-level estimates · View source
With a projected median salary of $143,965 in 2026, actuaries in Bellingham, WA, are positioned slightly above the national average, which stands at $134,160. This local salary range varies significantly, with entry-level positions beginning around $83,500 and reaching up to $223,146 for those at the highest echelons of the profession. These figures are derived from 2025 BLS data, projected to 2026, reflecting local market conditions and cost adjustments. Given Bellingham’s unique job market dynamics, actuaries here can expect not only favorable salaries but also opportunities for growth as the profession continues to expand.
About the Bellingham Market
Salary estimated from Washington average ($132,000) adjusted for local cost of living.
Salary Breakdown
| Percentile | Annual | Hourly |
|---|---|---|
| Entry Level (P10) | $83,500 | $40.14 |
| Lower Range (P25) | $104,767 | $50.37 |
| Median (P50)(typical) | $143,965 | $69.22 |
| Upper Range (P75) | $184,275 | $88.60 |
| Top Earners (P90) | $223,146 | $107.29 |
Median Salary Position
7.31% above the national average
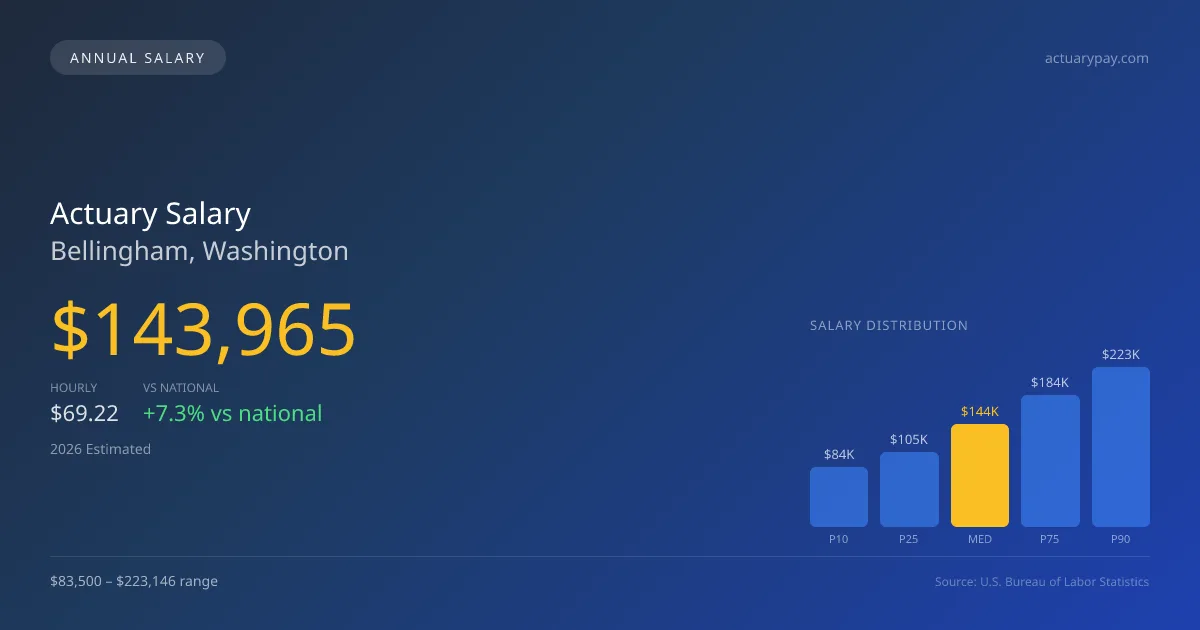
2026 Salary Percentile Distribution in Bellingham
In Bellingham, WA, the actuary salary spread from the 10th to 90th percentile is $139,646 (2026 est.). At $143,965, the local median is 7.31% above the national median of $134,160.
Salary Calculator
At 40 hours/week in Bellingham: You'd be in the lower-middle range
How Bellingham Actuary Pay Compares
Bellingham median: $143,965/year (2026)
| Compared To | Median Salary | Bellingham Pays |
|---|---|---|
| Washington Average | $144,109 | -0.10% less |
| National Average | $134,160 | +7.31% more |
Actuarys in Bellingham, WA earn a median of $143,965 per year (2026 est.), which is 7.31% higher than the national median of $134,160 and 0.10% below the Washington state average of $144,109.
Cost-of-Living Adjusted Salary
Bellingham has a cost of living 7.40% above the national average.
Adjusted salary = nominal × (100 / CoL index). CoL index: 100 = national average.
Bellingham, WA has a cost-of-living index of 107.4 (above the national average of 100). While the nominal salary of $143,965 is competitive, the higher cost of living reduces purchasing power to an effective $134,046 — a 6.89% reduction.
Compare Purchasing Power
Select a city to see how your salary compares after cost of living
Select a city above to compare purchasing power
2019 BLS Actual
$116,269
2025 BLS Actual
$139,501
2026 Current Est.
$143,965
2019–2027 Growth
+27.8%
Salary Trajectory for Actuaries in Bellingham (2019–2027)
2019–2025: actual BLS OEWS data for this metro area. 2026+: CAGR 3.20% projection.
| Year | Annual Salary | Status |
|---|---|---|
| 2019 | $116,269 | Actual |
| 2020 | $119,145 | Actual |
| 2021 | $113,640 | Actual |
| 2022 | $122,321 | Actual |
| 2023 | $128,770 | Actual |
| 2024 | $141,647 | Actual |
| 2025 | $139,501 | Actual |
| 2026(current) | $143,965 | Estimated |
| 2027 | $148,572 | Projected |
Based on 7 years of BLS OEWS data for the Bellingham metropolitan area, the median actuary salary grew 20.0% from $116,269 (2019) to $139,501 (2025). At a 3.20% compound annual growth rate, salaries are projected to reach $148,572 by 2027 — a total increase of $32,303 (27.78%) from 2019.
Note: Historical values (2019–2025) are actual BLS OEWS figures for the Bellingham metropolitan area, sourced from annual Occupational Employment and Wage Statistics surveys. 2026–2026 figures are current estimates, and 2027 values are projections, calculated using a 3.20% CAGR derived from 7-year BLS historical data. Actual salaries may vary based on employer, experience, certifications, and local market conditions.
Salary by Experience Level
| Experience | Estimated Salary Range |
|---|---|
| 0-2 years (New Graduate) | $83,500 – $104,767 |
| 3-5 years (Mid Career) | $104,767 – $143,965 |
| 5+ years (Experienced) | $143,965 – $184,275 |
| 10+ years (Top Earner) | $184,275 – $223,146 |
ASA, FSA salary ranges estimated from BLS percentile data. Individual actuary compensation varies by employer, certifications, and specialization.
Actuary Job Market in Bellingham
The local job market currently employs 13 actuaries, which indicates a niche but stable demand for actuarial services in Bellingham. The area's cost of living index sits at 107.4, slightly above the national average, suggesting that while salaries may be competitive, they are also balanced against higher living expenses. Among potential employers, life insurance firms like Prudential and Northwestern Mutual, along with consulting giants such as Mercer and Aon, tend to offer higher pay scales. Compensation varies widely based on factors like exam progression—a core component of actuarial pay—where each passed exam can add thousands to one’s salary. To maximize earnings in Bellingham, aspiring actuaries should focus on obtaining advanced fellow credentials, honing their skills in predictive analytics, and considering specialties in fields such as property and casualty, which often command higher pay than life or health.
More salary data for Bellingham, WA:
Frequently Asked Questions
How much do actuaries make in Bellingham, WA in 2026?
Is Bellingham, WA a good place to work as a actuary?
Can actuaries make $100K in Bellingham?
What is the cost-of-living adjusted actuary salary in Bellingham?
How much does a actuary make per hour in Bellingham?
Related Pages
Compare Salaries
Career Resources
Nearby Cities in Washington
Written by Maria Chen, FSA, MAAA
Career Analyst
Maria has 10 years of experience in life insurance. She specializes in risk assessment and pricing strategies.
Methodology & Data Source
Salary figures on this page are 2026 projections based on the Bureau of Labor Statistics Occupational Employment and Wage Statistics (OEWS) survey, May 2026 release. The BLS reported a median annual salary of $139,501 for actuariesin the Bellingham metropolitan area. A 3.20% compound annual growth rate (CAGR), calculated from 6-year national BLS wage trends, was applied to project current 2026 compensation. Percentile ranges (P10–P90) represent the full salary distribution across experience levels and practice settings in this market.
Data Sources & Methodology
Salary data for Bellingham is estimated from official BLS state-level occupational wage data (2025), adjusted for regional cost-of-living differences using BEA RPP (Regional Price Parities).
2026 figures are projected from 2025 BLS data using a compound annual growth rate (CAGR) of 3.20%, derived from historical BLS wage trends for actuarys (SOC 15-2011).
Compiled and verified by Maria Chen, FSA, MAAA, a licensed actuary with 10+ years of clinical experience. · View source data at BLS.gov