Actuary Salary in Ohio: $114,124 (2026)
Quick Answer:Across Ohio's 67 metropolitan areas, the average median actuary pay sits at $114,124/year heading into 2026 — a figure projected from 2025 BLS OEWS wage data for SOC 15-2011. Because Ohio sits at BEA RPP 90.7 (9% below the U.S. baseline), that statewide median translates to roughly $125,826 in nationally-comparable purchasing power. Highest-paying metros: Toledo ($120,413), Canton ($119,369), Lorain ($119,182).
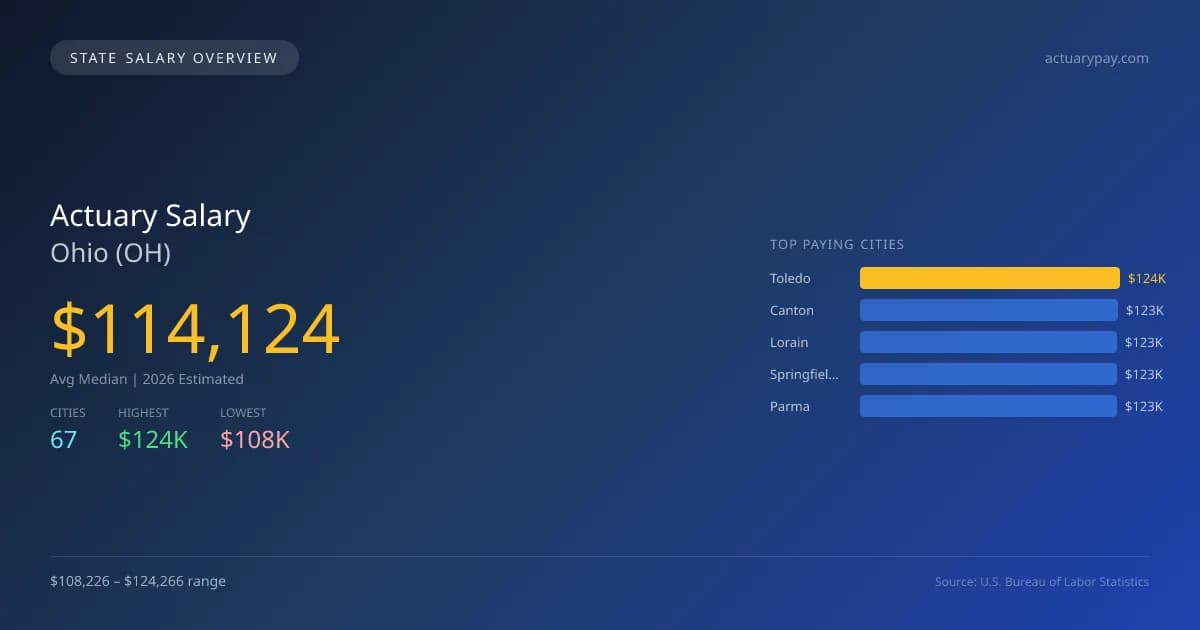
In Ohio, the projected average median salary for actuaries in 2026 is $114,124, which is significantly below the national median of $134,160, reflecting a variance of -14.9%. The highest-paying city in the state is Toledo, offering an average salary of $124,266, while Cleveland has the lowest at $108,226, resulting in a salary gap of $16,040. Factors contributing to this disparity include the cost of living, local demand for actuaries, and the concentration of employers in various sectors like insurance and finance. Ohio actuaries must navigate state licensing requirements that align with national standards, and staying current on continuing education ensures compliance with evolving regulations. The job market for actuaries in the state shows promise, with a projected annual growth rate of 3.20%, indicating steady demand for the profession. Major contributing factors to demand include increasing data analytics needs and risk management roles across various industries. The top five projected cities for actuary salaries in 2026, besides Toledo, are Canton at $123,189, Lorain at $122,996, Springfield at $122,765, and Parma at $122,658. Understanding regional dynamics will be essential for professionals seeking to maximize their career opportunities in Ohio.
Ohio Actuary Salary Range
Overall salary range in Ohio: $66,079 (lowest entry-level) to $192,612 (highest top earner)
Ohio vs National Average
Ohio actuaries earn 14.93% less than the national median ($-20,036/year difference).
Ohio Actuary Salary Distribution (2026)
Actuary salaries in Ohio range from $75,275 (entry-level, 10th percentile) to $179,024 (top earners, 90th percentile), with a median of $114,124. The Ohio median is $20,036 below the US national median of $134,160. The average hourly rate is $54.87/hr. Approximately 1,437 actuarys are employed across 67 cities.
2019 BLS Actual
$96,532
2025 BLS Actual
$110,585
2026 Current Est.
$114,124
2019–2027 Growth
+22.0%
Salary Trajectory for Actuaries in Ohio (2019–2027)
2019–2025: actual BLS OEWS data for this metro area. 2026+: CAGR 3.20% projection.
| Year | Annual Salary | Status |
|---|---|---|
| 2019 | $96,532 | Actual |
| 2020 | $90,928 | Actual |
| 2021 | $100,606 | Actual |
| 2022 | $102,331 | Actual |
| 2023 | $112,383 | Actual |
| 2024 | $109,885 | Actual |
| 2025 | $110,585 | Actual |
| 2026(current) | $114,124 | Estimated |
| 2027 | $117,776 | Projected |
Based on 7 years of BLS OEWS data for the Ohio metropolitan area, the median actuary salary grew 14.6% from $96,532 (2019) to $110,585 (2025). At a 3.20% compound annual growth rate, salaries are projected to reach $117,776 by 2027 — a total increase of $21,244 (22.01%) from 2019.
Note: Historical values (2019–2025) are actual BLS OEWS figures for the Ohio metropolitan area, sourced from annual Occupational Employment and Wage Statistics surveys. 2026–2026 figures are current estimates, and 2027 values are projections, calculated using a 3.20% CAGR derived from 7-year BLS historical data. Actual salaries may vary based on employer, experience, certifications, and local market conditions.
Top 5 Highest Paying Cities in Ohio
Lowest Paying Cities in Ohio
| City | Median Salary |
|---|---|
| Cleveland | $108,226 |
| Columbus | $109,949 |
| Solon | $111,834 |
| Centerville | $111,852 |
| Avon Lake | $112,099 |
Best Value Cities for Actuaries in Ohio
When adjusted for local cost of living, these Ohio cities offer the most purchasing power for actuaries.
| City | Nominal Salary | CoL Index | Adjusted Salary |
|---|---|---|---|
| Toledo | $124,266 | 90.7 | $137,008 |
| Canton | $123,189 | 90.7 | $135,820 |
| Lorain | $122,996 | 90.7 | $135,607 |
| Springfield | $122,765 | 90.7 | $135,353 |
| Parma | $122,658 | 90.7 | $135,235 |
Adjusted salary = nominal salary × (100 / CoL index). CoL index: 100 = national average. Lower index = lower cost of living.
Salary by Experience Level in Ohio
| Experience Level | Estimated Annual |
|---|---|
| Entry Level (0-2 years) | $75,275 |
| Mid Career (3-7 years) | $114,124 |
| Experienced (7+ years) | $179,024 |
Estimates based on BLS percentile data averaged across Ohio metro areas. Individual pay varies by employer, certifications, and specialization.
All 67 Cities in Ohio
| # | City | Median Salary |
|---|---|---|
| 1 | Toledo | $124,266 |
| 2 | Canton | $123,189 |
| 3 | Lorain | $122,996 |
| 4 | Springfield | $122,765 |
| 5 | Parma | $122,658 |
| 6 | Cuyahoga Falls | $122,158 |
| 7 | Hamilton | $121,734 |
| 8 | Akron | $121,188 |
| 9 | Lakewood | $121,069 |
| 10 | Sandusky | $120,927 |
| 11 | Bowling Green | $120,908 |
| 12 | Lancaster | $120,870 |
| 13 | Zanesville | $120,861 |
| 14 | Westlake | $120,653 |
| 15 | Middletown | $120,606 |
| 16 | Grove City | $120,256 |
| 17 | Delaware | $120,162 |
| 18 | Gahanna | $120,143 |
| 19 | Westerville | $120,067 |
| 20 | Dayton | $120,014 |
| 21 | Huber Heights | $119,784 |
| 22 | Lima | $119,700 |
| 23 | North Ridgeville | $119,689 |
| 24 | North Royalton | $119,520 |
| 25 | North Olmsted | $119,095 |
| 26 | Reynoldsburg | $118,887 |
| 27 | Kettering | $118,842 |
| 28 | Youngstown | $118,640 |
| 29 | Strongsville | $118,490 |
| 30 | Mansfield | $118,368 |
| 31 | Warren | $118,321 |
| 32 | Beavercreek | $118,217 |
| 33 | Brunswick | $117,754 |
| 34 | Wooster | $117,754 |
| 35 | Elyria | $117,571 |
| 36 | Shaker Heights | $117,331 |
| 37 | Medina | $117,254 |
| 38 | Dublin | $116,876 |
| 39 | Fairfield | $116,867 |
| 40 | Mentor | $116,744 |
| 41 | Massillon | $116,432 |
| 42 | Mason | $116,234 |
| 43 | Avon | $116,089 |
| 44 | Marion | $115,913 |
| 45 | Stow | $115,903 |
| 46 | Newark | $115,837 |
| 47 | Findlay | $115,714 |
| 48 | Green | $115,535 |
| 49 | Barberton | $115,535 |
| 50 | Austintown | $115,488 |
| 51 | Cleveland Heights | $115,469 |
| 52 | Upper Arlington | $115,318 |
| 53 | Xenia | $115,318 |
| 54 | Hilliard | $115,176 |
| 55 | Oxford | $114,817 |
| 56 | Chillicothe | $114,570 |
| 57 | Perrysburg | $114,148 |
| 58 | Trotwood | $114,112 |
| 59 | Athens | $112,904 |
| 60 | Tiffin | $112,273 |
| 61 | Cincinnati | $112,251 |
| 62 | Wadsworth | $112,181 |
| 63 | Avon Lake | $112,099 |
| 64 | Centerville | $111,852 |
| 65 | Solon | $111,834 |
| 66 | Columbus | $109,949 |
| 67 | Cleveland | $108,226 |
More Ohio Salary Data
Compare Cities in Ohio
View all comparisons →Explore More Actuary Salary Data
Frequently Asked Questions
How much do actuaries make in Ohio in 2026?
What is the highest paying city for actuaries in Ohio?
How does Ohio actuary pay compare to the national average?
What is the entry-level actuary salary in Ohio?
How many actuaries are employed in Ohio?
Which Ohio city offers the best value for actuaries?
Written by Maria Chen, FSA, MAAA
Career Analyst
Maria has 10 years of experience in life insurance. She specializes in risk assessment and pricing strategies.
Methodology & Data Source
Statewide salary figures on this page are 2026 projections based on the Bureau of Labor Statistics Occupational Employment and Wage Statistics (OEWS) survey, May 2026 release. A 3.20% compound annual growth rate (CAGR), derived from 6-year national BLS wage trends, was applied to each metro area's reported salary to estimate current 2026 actuary compensation across Ohio. State averages are employment-weighted across 67 metro areas — larger metro areas with more actuariescontribute proportionally more to the average, producing figures that better reflect typical compensation. Individual pay varies by city, employer, certifications, and experience.
Data Sources & Methodology
Source: BLS, OEWS, 7-year dataset (–). Per-city data from annual BLS metropolitan area surveys.
2026 figures are projected from 2025 BLS data using a compound annual growth rate (CAGR) of 3.20%, derived from historical BLS wage trends for actuarys (SOC 15-2011).
Compiled and verified by Maria Chen, FSA, MAAA, a licensed actuary with 10+ years of clinical experience. · View source data at BLS.gov