Actuary Salary in Richfield, MN: $127,286 (2026)
Quick Answer:A full-time actuary in Richfield, MN earns a median $127,286/year (≈ $61.20/hour) in nominal terms for 2026 — projected from BLS OEWS 2025 (SOC 15-2011). Once you factor in Richfield's price level (1% below national, BEA RPP 98.5), that paycheck buys what $129,224 would nationally. Nominal pay sits 3.7% below the Minnesota state average.
Based on BLS state-level estimates · View source
In 2026, actuary salaries in Richfield, Minnesota, are projected to sit at a median of $127,286, which is slightly below the national median of $134,160. Salaries for actuaries in this area range from about $83,030 at the 10th percentile to approximately $197,293 at the 90th percentile. These figures reflect local estimates derived from 2025 BLS data and are adjusted for the regional cost of living. Compared to other markets, actuaries in Richfield might expect slightly lower pay, particularly if they transition from working in consulting firms like Milliman and Mercer, which often offer higher compensation for FSAs and FCAS credentialed professionals, to positions with local insurers or health care companies.
About the Richfield Market
Salary estimated from Minnesota average ($128,000) adjusted for local cost of living.
Salary Breakdown
| Percentile | Annual | Hourly |
|---|---|---|
| Entry Level (P10) | $83,030 | $39.92 |
| Lower Range (P25) | $99,286 | $47.73 |
| Median (P50)(typical) | $127,286 | $61.20 |
| Upper Range (P75) | $161,294 | $77.54 |
| Top Earners (P90) | $197,293 | $94.85 |
Median Salary Position
5.12% below the national average
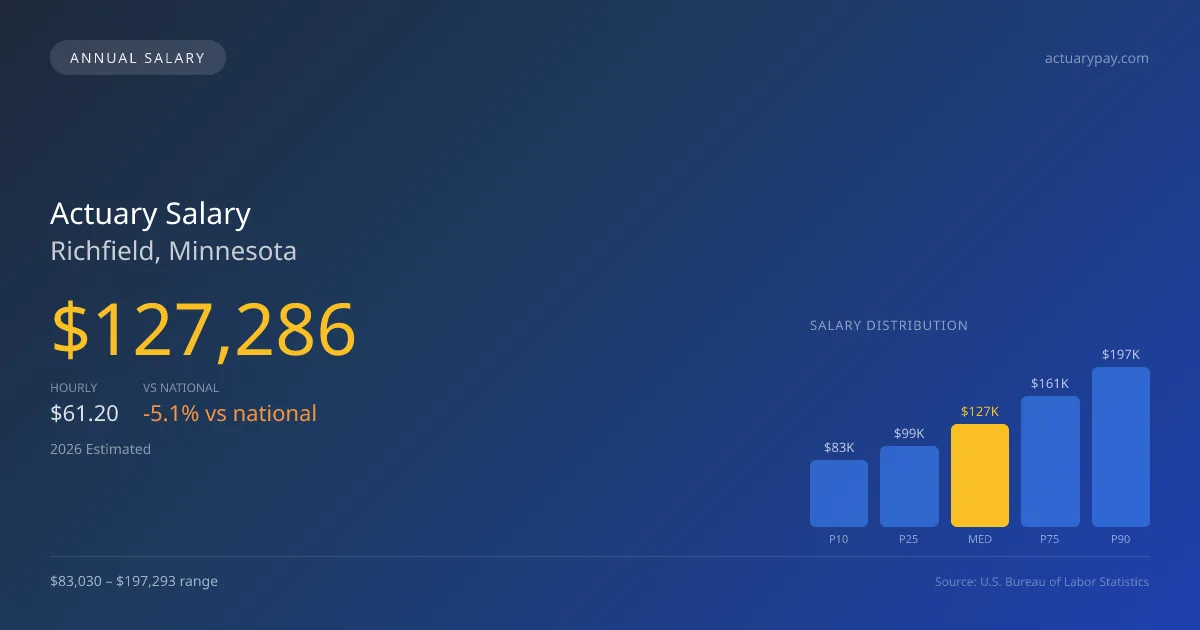
2026 Salary Percentile Distribution in Richfield
In Richfield, MN, the actuary salary spread from the 10th to 90th percentile is $114,263 (2026 est.). At $127,286, the local median is 5.12% below the national median of $134,160.
Salary Calculator
At 40 hours/week in Richfield: You'd be in the lower-middle range
How Richfield Actuary Pay Compares
Richfield median: $127,286/year (2026)
| Compared To | Median Salary | Richfield Pays |
|---|---|---|
| Minnesota Average | $132,176 | -3.70% less |
| National Average | $134,160 | -5.12% less |
Actuarys in Richfield, MN earn a median of $127,286 per year (2026 est.), which is 5.12% lower than the national median of $134,160 and 3.70% below the Minnesota state average of $132,176.
Cost-of-Living Adjusted Salary
Richfield has a cost of living 1.50% below the national average, meaning your salary goes further here.
Adjusted salary = nominal × (100 / CoL index). CoL index: 100 = national average.
Richfield, MN has a cost-of-living index of 98.5 (below the national average of 100). A actuary earning $127,286 nominally has purchasing power equivalent to $129,224 in an average-cost city — an effective 1.52% boost.
Compare Purchasing Power
Select a city to see how your salary compares after cost of living
Select a city above to compare purchasing power
2019 BLS Actual
$102,798
2025 BLS Actual
$123,339
2026 Current Est.
$127,286
2019–2027 Growth
+27.8%
Salary Trajectory for Actuaries in Richfield (2019–2027)
2019–2025: actual BLS OEWS data for this metro area. 2026+: CAGR 3.20% projection.
| Year | Annual Salary | Status |
|---|---|---|
| 2019 | $102,798 | Actual |
| 2020 | $105,341 | Actual |
| 2021 | $100,474 | Actual |
| 2022 | $108,149 | Actual |
| 2023 | $113,851 | Actual |
| 2024 | $121,442 | Actual |
| 2025 | $123,339 | Actual |
| 2026(current) | $127,286 | Estimated |
| 2027 | $131,359 | Projected |
Based on 7 years of BLS OEWS data for the Richfield metropolitan area, the median actuary salary grew 20.0% from $102,798 (2019) to $123,339 (2025). At a 3.20% compound annual growth rate, salaries are projected to reach $131,359 by 2027 — a total increase of $28,561 (27.78%) from 2019.
Note: Historical values (2019–2025) are actual BLS OEWS figures for the Richfield metropolitan area, sourced from annual Occupational Employment and Wage Statistics surveys. 2026–2026 figures are current estimates, and 2027 values are projections, calculated using a 3.20% CAGR derived from 7-year BLS historical data. Actual salaries may vary based on employer, experience, certifications, and local market conditions.
Salary by Experience Level
| Experience | Estimated Salary Range |
|---|---|
| 0-2 years (New Graduate) | $83,030 – $99,286 |
| 3-5 years (Mid Career) | $99,286 – $127,286 |
| 5+ years (Experienced) | $127,286 – $161,294 |
| 10+ years (Top Earner) | $161,294 – $197,293 |
ASA, FSA salary ranges estimated from BLS percentile data. Individual actuary compensation varies by employer, certifications, and specialization.
Actuary Job Market in Richfield
The job market for actuaries in Richfield currently employs nine professionals, presenting an opportunity for growth within this niche sector. With a cost of living index of 98.5, the pricing on goods and services is slightly below the national average, positively impacting take-home pay. In this area, employers that tend to offer the most competitive salaries include large health insurance companies and consulting firms, with lucrative positions in property and casualty and reinsurance sectors as well. The variance in income levels can be driven by factors such as exam progression and the associated pay increases, different credential levels like ASA and FSA, and the specific focus of the market—consulting positions typically command a premium for advanced qualifications. For those looking to maximize their actuary pay in Richfield, focusing on passing actuarial exams and developing expertise in predictive analytics could greatly enhance earning potential.
More salary data for Richfield, MN:
Frequently Asked Questions
How much do actuaries make in Richfield, MN in 2026?
Is Richfield, MN a good place to work as a actuary?
Can actuaries make $100K in Richfield?
What is the cost-of-living adjusted actuary salary in Richfield?
How much does a actuary make per hour in Richfield?
Related Pages
Compare Salaries
Career Resources
Nearby Cities in Minnesota
Written by Maria Chen, FSA, MAAA
Career Analyst
Maria has 10 years of experience in life insurance. She specializes in risk assessment and pricing strategies.
Methodology & Data Source
Salary figures on this page are 2026 projections based on the Bureau of Labor Statistics Occupational Employment and Wage Statistics (OEWS) survey, May 2026 release. The BLS reported a median annual salary of $123,339 for actuariesin the Richfield metropolitan area. A 3.20% compound annual growth rate (CAGR), calculated from 6-year national BLS wage trends, was applied to project current 2026 compensation. Percentile ranges (P10–P90) represent the full salary distribution across experience levels and practice settings in this market.
Data Sources & Methodology
Salary data for Richfield is estimated from official BLS state-level occupational wage data (2025), adjusted for regional cost-of-living differences using BEA RPP (Regional Price Parities).
2026 figures are projected from 2025 BLS data using a compound annual growth rate (CAGR) of 3.20%, derived from historical BLS wage trends for actuarys (SOC 15-2011).
Compiled and verified by Maria Chen, FSA, MAAA, a licensed actuary with 10+ years of clinical experience. · View source data at BLS.gov