Actuary Salary in Plymouth, MN: $130,779 (2026)
Quick Answer:A full-time actuary in Plymouth, MN earns a median $130,779/year (≈ $62.88/hour) in nominal terms for 2026 — projected from BLS OEWS 2025 (SOC 15-2011). Once you factor in Plymouth's price level (1% below national, BEA RPP 98.5), that paycheck buys what $132,771 would nationally. Nominal pay sits 1.0% below the Minnesota state average.
Based on BLS state-level estimates · View source
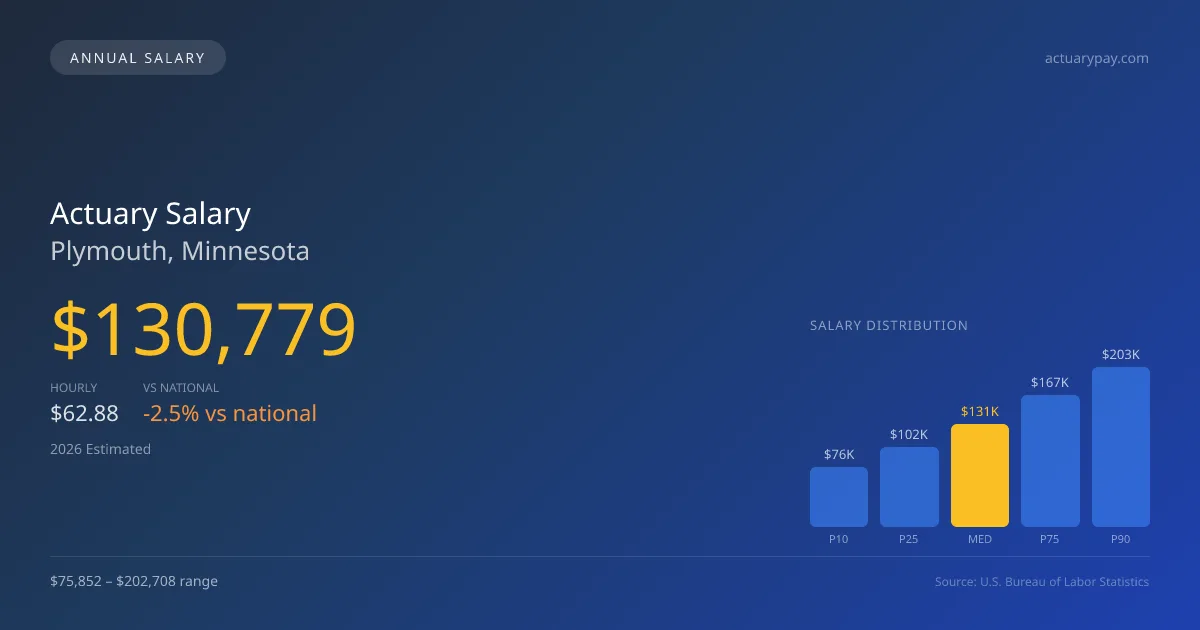
In Plymouth, Minnesota, the 2026 median annual salary for actuaries is projected at $130,779, which is slightly lower than the national median of $134,160, reflecting a difference of about 2.52%. Local salary estimates indicate a range from $75,852 at the 10th percentile to $202,708 at the 90th percentile, showcasing a significant disparity in compensation among professionals in the field. These figures, derived from 2025 BLS data and regional cost adjustments, highlight the competitive nature of the actuarial job market in Plymouth, particularly between those aligned with the Society of Actuaries (SOA) for life, health, and pension sectors versus those connected with the Casualty Actuarial Society (CAS) for property and casualty specialties. As such, the choice of actuarial focus can heavily influence overall career earning potential in the region.
About the Plymouth Market
Salary estimated from Minnesota average ($128,000) adjusted for local cost of living.
Salary Breakdown
| Percentile | Annual | Hourly |
|---|---|---|
| Entry Level (P10) | $75,852 | $36.47 |
| Lower Range (P25) | $101,511 | $48.80 |
| Median (P50)(typical) | $130,779 | $62.88 |
| Upper Range (P75) | $167,398 | $80.48 |
| Top Earners (P90) | $202,708 | $97.45 |
Median Salary Position
2.52% below the national average
2026 Salary Percentile Distribution in Plymouth
In Plymouth, MN, the actuary salary spread from the 10th to 90th percentile is $126,856 (2026 est.). At $130,779, the local median is 2.52% below the national median of $134,160.
Salary Calculator
At 40 hours/week in Plymouth: You'd be in the lower-middle range
How Plymouth Actuary Pay Compares
Plymouth median: $130,779/year (2026)
| Compared To | Median Salary | Plymouth Pays |
|---|---|---|
| Minnesota Average | $132,100 | -1.00% less |
| National Average | $134,160 | -2.52% less |
Actuarys in Plymouth, MN earn a median of $130,779 per year (2026 est.), which is 2.52% lower than the national median of $134,160 and 1.00% below the Minnesota state average of $132,100.
Cost-of-Living Adjusted Salary
Plymouth has a cost of living 1.50% below the national average, meaning your salary goes further here.
Adjusted salary = nominal × (100 / CoL index). CoL index: 100 = national average.
Plymouth, MN has a cost-of-living index of 98.5 (below the national average of 100). A actuary earning $130,779 nominally has purchasing power equivalent to $132,771 in an average-cost city — an effective 1.52% boost.
Compare Purchasing Power
Select a city to see how your salary compares after cost of living
Select a city above to compare purchasing power
2019 BLS Actual
$105,620
2025 BLS Actual
$126,724
2026 Current Est.
$130,779
2019–2027 Growth
+27.8%
Salary Trajectory for Actuaries in Plymouth (2019–2027)
2019–2025: actual BLS OEWS data for this metro area. 2026+: CAGR 3.20% projection.
| Year | Annual Salary | Status |
|---|---|---|
| 2019 | $105,620 | Actual |
| 2020 | $108,232 | Actual |
| 2021 | $103,231 | Actual |
| 2022 | $111,117 | Actual |
| 2023 | $116,976 | Actual |
| 2024 | $124,774 | Actual |
| 2025 | $126,724 | Actual |
| 2026(current) | $130,779 | Estimated |
| 2027 | $134,964 | Projected |
Based on 7 years of BLS OEWS data for the Plymouth metropolitan area, the median actuary salary grew 20.0% from $105,620 (2019) to $126,724 (2025). At a 3.20% compound annual growth rate, salaries are projected to reach $134,964 by 2027 — a total increase of $29,344 (27.78%) from 2019.
Note: Historical values (2019–2025) are actual BLS OEWS figures for the Plymouth metropolitan area, sourced from annual Occupational Employment and Wage Statistics surveys. 2026–2026 figures are current estimates, and 2027 values are projections, calculated using a 3.20% CAGR derived from 7-year BLS historical data. Actual salaries may vary based on employer, experience, certifications, and local market conditions.
Salary by Experience Level
| Experience | Estimated Salary Range |
|---|---|
| 0-2 years (New Graduate) | $75,852 – $101,511 |
| 3-5 years (Mid Career) | $101,511 – $130,779 |
| 5+ years (Experienced) | $130,779 – $167,398 |
| 10+ years (Top Earner) | $167,398 – $202,708 |
ASA, FSA salary ranges estimated from BLS percentile data. Individual actuary compensation varies by employer, certifications, and specialization.
Actuary Job Market in Plymouth
Currently, Plymouth employs 14 actuaries, contributing to a niche employment market in the area. The local cost-of-living index sits at 98.5, indicating that expenses are somewhat lower than the national average, which can positively impact take-home purchasing power for those working in actuary positions. Among the major employers, companies like UnitedHealth and Cigna in the health sector are recognized for offering competitive salaries. Factors such as exam progression and increased responsibilities correlated with higher credential tiers—moving from ASA to FSA—significantly impact earning potential. Specialty matters, with property and casualty focuses generally yielding higher pay compared to life insurance roles. To maximize earnings in this specific Plymouth market, actuaries should prioritize acquiring relevant VEE credits, pursue advanced credentials, and seek roles at consulting firms known for premium compensation packages.
More salary data for Plymouth, MN:
Frequently Asked Questions
How much do actuaries make in Plymouth, MN in 2026?
Is Plymouth, MN a good place to work as a actuary?
Can actuaries make $100K in Plymouth?
What is the cost-of-living adjusted actuary salary in Plymouth?
How much does a actuary make per hour in Plymouth?
Related Pages
Compare Salaries
Career Resources
Nearby Cities in Minnesota
Written by Maria Chen, FSA, MAAA
Career Analyst
Maria has 10 years of experience in life insurance. She specializes in risk assessment and pricing strategies.
Methodology & Data Source
Salary figures on this page are 2026 projections based on the Bureau of Labor Statistics Occupational Employment and Wage Statistics (OEWS) survey, May 2026 release. The BLS reported a median annual salary of $126,724 for actuariesin the Plymouth metropolitan area. A 3.20% compound annual growth rate (CAGR), calculated from 6-year national BLS wage trends, was applied to project current 2026 compensation. Percentile ranges (P10–P90) represent the full salary distribution across experience levels and practice settings in this market.
Data Sources & Methodology
Salary data for Plymouth is estimated from official BLS state-level occupational wage data (2025), adjusted for regional cost-of-living differences using BEA RPP (Regional Price Parities).
2026 figures are projected from 2025 BLS data using a compound annual growth rate (CAGR) of 3.20%, derived from historical BLS wage trends for actuarys (SOC 15-2011).
Compiled and verified by Maria Chen, FSA, MAAA, a licensed actuary with 10+ years of clinical experience. · View source data at BLS.gov