Actuary Salary in Richmond, KY: $105,881 (2026)
Quick Answer:A full-time actuary in Richmond, KY earns a median $105,881/year (≈ $50.91/hour) in nominal terms for 2026 — projected from BLS OEWS 2025 (SOC 15-2011). Once you factor in Richmond's price level (11% below national, BEA RPP 89.3), that paycheck buys what $118,568 would nationally. Nominal pay sits 1.5% below the Kentucky state average.
Based on BLS state-level estimates · View source
In Richmond, KY, the actuary salary is projected to reach a median of $105,881 in 2026. This figure reflects local estimates based on 2025 BLS data and regional cost adjustments within the market. The salary range for actuaries in the area spans from $64,190 at the 10th percentile to $164,116 at the 90th percentile. While actuaries specializing in life, health, and pension through the SOA often see different pay scales compared to those in property and casualty under the CAS, Richmond's current salary offerings present a distinct scenario compared to national averages. Locally, the expected compensation indicates a potential gap when compared to the national median of $134,160, highlighting the competitive challenges faced by professionals in the region.
About the Richmond Market
Salary estimated from Kentucky average ($108,000) adjusted for local cost of living.
Salary Breakdown
| Percentile | Annual | Hourly |
|---|---|---|
| Entry Level (P10) | $64,190 | $30.86 |
| Lower Range (P25) | $78,988 | $37.98 |
| Median (P50)(typical) | $105,881 | $50.91 |
| Upper Range (P75) | $135,527 | $65.16 |
| Top Earners (P90) | $164,116 | $78.91 |
Median Salary Position
21.08% below the national average
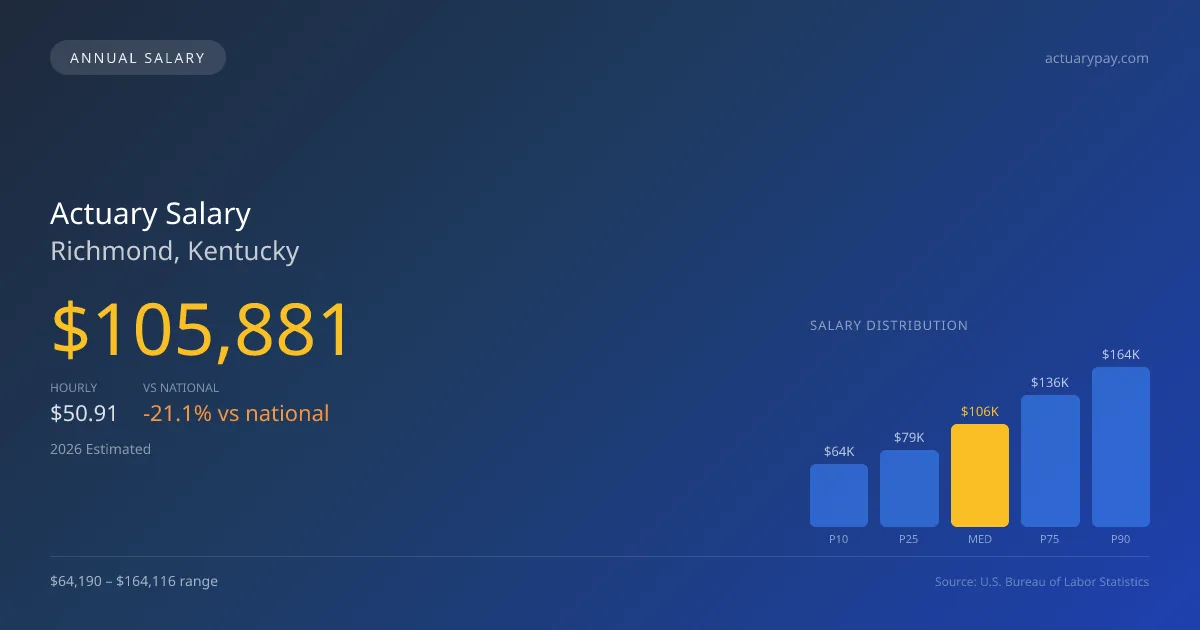
2026 Salary Percentile Distribution in Richmond
In Richmond, KY, the actuary salary spread from the 10th to 90th percentile is $99,926 (2026 est.). At $105,881, the local median is 21.08% below the national median of $134,160.
Salary Calculator
At 40 hours/week in Richmond: You'd be in the lower-middle range
How Richmond Actuary Pay Compares
Richmond median: $105,881/year (2026)
| Compared To | Median Salary | Richmond Pays |
|---|---|---|
| Kentucky Average | $107,494 | -1.50% less |
| National Average | $134,160 | -21.08% less |
Actuarys in Richmond, KY earn a median of $105,881 per year (2026 est.), which is 21.08% lower than the national median of $134,160 and 1.50% below the Kentucky state average of $107,494.
Cost-of-Living Adjusted Salary
Richmond has a cost of living 10.70% below the national average, meaning your salary goes further here.
Adjusted salary = nominal × (100 / CoL index). CoL index: 100 = national average.
Richmond, KY has a cost-of-living index of 89.3 (below the national average of 100). A actuary earning $105,881 nominally has purchasing power equivalent to $118,568 in an average-cost city — an effective 11.98% boost.
Compare Purchasing Power
Select a city to see how your salary compares after cost of living
Select a city above to compare purchasing power
2019 BLS Actual
$85,511
2025 BLS Actual
$102,598
2026 Current Est.
$105,881
2019–2027 Growth
+27.8%
Salary Trajectory for Actuaries in Richmond (2019–2027)
2019–2025: actual BLS OEWS data for this metro area. 2026+: CAGR 3.20% projection.
| Year | Annual Salary | Status |
|---|---|---|
| 2019 | $85,511 | Actual |
| 2020 | $87,627 | Actual |
| 2021 | $83,578 | Actual |
| 2022 | $89,963 | Actual |
| 2023 | $94,706 | Actual |
| 2024 | $94,961 | Actual |
| 2025 | $102,598 | Actual |
| 2026(current) | $105,881 | Estimated |
| 2027 | $109,269 | Projected |
Based on 7 years of BLS OEWS data for the Richmond metropolitan area, the median actuary salary grew 20.0% from $85,511 (2019) to $102,598 (2025). At a 3.20% compound annual growth rate, salaries are projected to reach $109,269 by 2027 — a total increase of $23,758 (27.78%) from 2019.
Note: Historical values (2019–2025) are actual BLS OEWS figures for the Richmond metropolitan area, sourced from annual Occupational Employment and Wage Statistics surveys. 2026–2026 figures are current estimates, and 2027 values are projections, calculated using a 3.20% CAGR derived from 7-year BLS historical data. Actual salaries may vary based on employer, experience, certifications, and local market conditions.
Salary by Experience Level
| Experience | Estimated Salary Range |
|---|---|
| 0-2 years (New Graduate) | $64,190 – $78,988 |
| 3-5 years (Mid Career) | $78,988 – $105,881 |
| 5+ years (Experienced) | $105,881 – $135,527 |
| 10+ years (Top Earner) | $135,527 – $164,116 |
ASA, FSA salary ranges estimated from BLS percentile data. Individual actuary compensation varies by employer, certifications, and specialization.
Actuary Job Market in Richmond
The job market for actuaries in Richmond remains relatively small, with only five actuaries currently employed in the area. The local cost of living index of 89.3, which is below the national average, suggests that take-home pay can be stretched further, benefiting professionals working in this environment. Employers offering the highest salaries tend to be entrenched in the life insurance sector, such as Prudential and MetLife, with health and managed care companies like UnitedHealth also contributing positively to compensation. The income disparity within the group often stems from factors such as exam progression, with each passed exam substantially increasing base pay, and the level of credentialing, with FSAs and FCAS seeing better compensation opportunities, particularly in consulting firms like Milliman and Aon. To maximize pay, aspiring actuaries should focus on continued education and certification, while actively seeking positions that allow for professional mobility within these industries, enhancing both their resumes and earning potential in Richmond.
More salary data for Richmond, KY:
Frequently Asked Questions
How much do actuaries make in Richmond, KY in 2026?
Is Richmond, KY a good place to work as a actuary?
Can actuaries make $100K in Richmond?
What is the cost-of-living adjusted actuary salary in Richmond?
How much does a actuary make per hour in Richmond?
Related Pages
Compare Salaries
Career Resources
Nearby Cities in Kentucky
Written by Maria Chen, FSA, MAAA
Career Analyst
Maria has 10 years of experience in life insurance. She specializes in risk assessment and pricing strategies.
Methodology & Data Source
Salary figures on this page are 2026 projections based on the Bureau of Labor Statistics Occupational Employment and Wage Statistics (OEWS) survey, May 2026 release. The BLS reported a median annual salary of $102,598 for actuariesin the Richmond metropolitan area. A 3.20% compound annual growth rate (CAGR), calculated from 6-year national BLS wage trends, was applied to project current 2026 compensation. Percentile ranges (P10–P90) represent the full salary distribution across experience levels and practice settings in this market.
Data Sources & Methodology
Salary data for Richmond is estimated from official BLS state-level occupational wage data (2025), adjusted for regional cost-of-living differences using BEA RPP (Regional Price Parities).
2026 figures are projected from 2025 BLS data using a compound annual growth rate (CAGR) of 3.20%, derived from historical BLS wage trends for actuarys (SOC 15-2011).
Compiled and verified by Maria Chen, FSA, MAAA, a licensed actuary with 10+ years of clinical experience. · View source data at BLS.gov