Actuary Salary in Illinois: $120,391 (2026)
Quick Answer:Across Illinois's 64 metropolitan areas, the average median actuary pay sits at $120,391/year heading into 2026 — a figure projected from 2025 BLS OEWS wage data for SOC 15-2011. Because Illinois sits at BEA RPP 97.1 (3% below the U.S. baseline), that statewide median translates to roughly $123,987 in nationally-comparable purchasing power. Highest-paying metros: Decatur ($127,992), Orland Park ($127,992), Bolingbrook ($127,442).
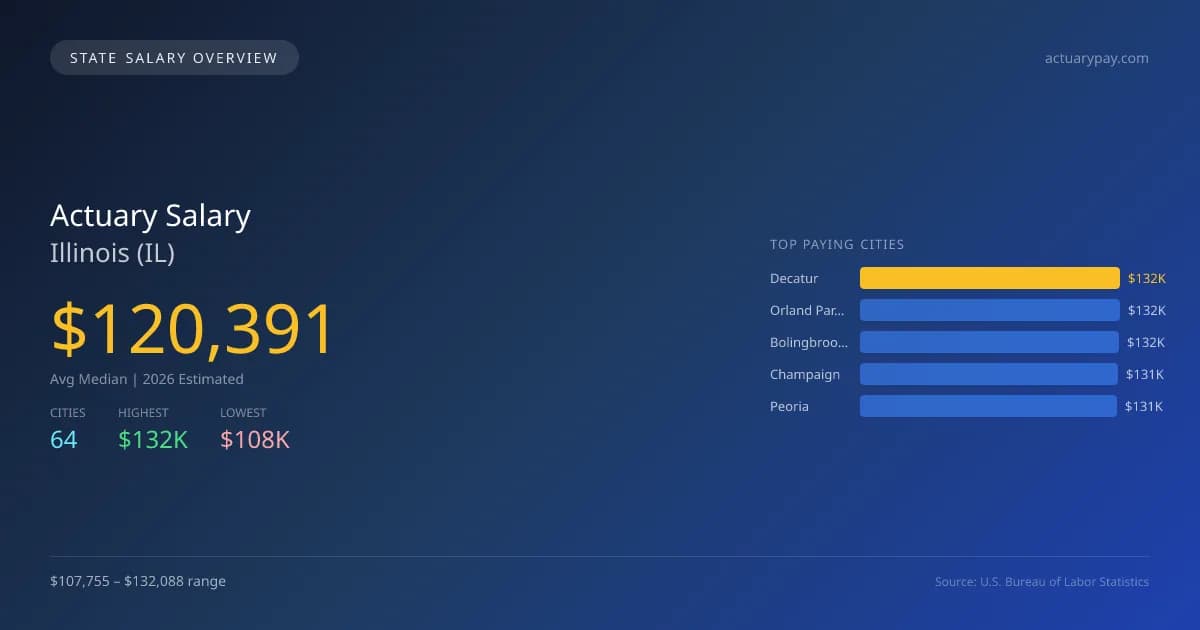
In Illinois, the average median salary for actuaries in 2026 is projected to be $120,391, which is approximately 10.3% below the national median of $134,160. The salary range varies significantly across the state, with Decatur and Orland Park leading at $132,088 each, while Rock Island offers the lowest compensation at $107,755. This nearly $24,333 salary gap can be attributed to the varying demand for actuaries, cost of living differences, and the concentration of financial services in certain areas. Illinois has specific licensing requirements, along with scope of practice laws that govern the actuarial profession. The state’s job market for actuaries is projected to grow at an annual rate of 3.20%, indicating a steady demand for professionals in this field. Currently, Illinois has a total of 2,303 actuaries employed, suggesting a solid job market. The demand is often driven by sectors such as insurance, healthcare, and finance, which are well-established in many regions of the state. Overall, those entering the actuarial profession in Illinois can expect a stable job outlook and a structured path to career development, although they should be mindful of the regional salary differences.
Illinois Actuary Salary Range
Overall salary range in Illinois: $63,449 (lowest entry-level) to $215,956 (highest top earner)
Illinois vs National Average
Illinois actuaries earn 10.26% less than the national median ($-13,769/year difference).
Illinois Actuary Salary Distribution (2026)
Actuary salaries in Illinois range from $80,796 (entry-level, 10th percentile) to $209,501 (top earners, 90th percentile), with a median of $120,391. The Illinois median is $13,769 below the US national median of $134,160. The average hourly rate is $57.88/hr. Approximately 2,303 actuarys are employed across 64 cities.
2019 BLS Actual
$102,951
2025 BLS Actual
$116,658
2026 Current Est.
$120,391
2019–2027 Growth
+20.7%
Salary Trajectory for Actuaries in Illinois (2019–2027)
2019–2025: actual BLS OEWS data for this metro area. 2026+: CAGR 3.20% projection.
| Year | Annual Salary | Status |
|---|---|---|
| 2019 | $102,951 | Actual |
| 2020 | $105,870 | Actual |
| 2021 | $102,390 | Actual |
| 2022 | $108,928 | Actual |
| 2023 | $121,300 | Actual |
| 2024 | $124,943 | Actual |
| 2025 | $116,658 | Actual |
| 2026(current) | $120,391 | Estimated |
| 2027 | $124,244 | Projected |
Based on 7 years of BLS OEWS data for the Illinois metropolitan area, the median actuary salary grew 13.3% from $102,951 (2019) to $116,658 (2025). At a 3.20% compound annual growth rate, salaries are projected to reach $124,244 by 2027 — a total increase of $21,293 (20.68%) from 2019.
Note: Historical values (2019–2025) are actual BLS OEWS figures for the Illinois metropolitan area, sourced from annual Occupational Employment and Wage Statistics surveys. 2026–2026 figures are current estimates, and 2027 values are projections, calculated using a 3.20% CAGR derived from 7-year BLS historical data. Actual salaries may vary based on employer, experience, certifications, and local market conditions.
Top 5 Highest Paying Cities in Illinois
Lowest Paying Cities in Illinois
| City | Median Salary |
|---|---|
| Rock Island | $107,755 |
| Moline | $109,451 |
| Elgin | $116,323 |
| Chicago | $117,369 |
| Naperville | $118,594 |
Best Value Cities for Actuaries in Illinois
When adjusted for local cost of living, these Illinois cities offer the most purchasing power for actuaries.
| City | Nominal Salary | CoL Index | Adjusted Salary |
|---|---|---|---|
| Decatur | $132,088 | 97.1 | $136,033 |
| Orland Park | $132,088 | 97.1 | $136,033 |
| Bolingbrook | $131,520 | 97.1 | $135,448 |
| Champaign | $131,211 | 97.1 | $135,130 |
| Peoria | $130,599 | 97.1 | $134,499 |
Adjusted salary = nominal salary × (100 / CoL index). CoL index: 100 = national average. Lower index = lower cost of living.
Salary by Experience Level in Illinois
| Experience Level | Estimated Annual |
|---|---|
| Entry Level (0-2 years) | $80,796 |
| Mid Career (3-7 years) | $120,391 |
| Experienced (7+ years) | $209,501 |
Estimates based on BLS percentile data averaged across Illinois metro areas. Individual pay varies by employer, certifications, and specialization.
All 64 Cities in Illinois
| # | City | Median Salary |
|---|---|---|
| 1 | Decatur | $132,088 |
| 2 | Orland Park | $132,088 |
| 3 | Bolingbrook | $131,520 |
| 4 | Champaign | $131,211 |
| 5 | Peoria | $130,599 |
| 6 | Palatine | $130,529 |
| 7 | Waukegan | $130,457 |
| 8 | Mount Prospect | $130,210 |
| 9 | Hoffman Estates | $129,786 |
| 10 | Evanston | $129,540 |
| 11 | Joliet | $129,430 |
| 12 | Oak Park | $129,323 |
| 13 | Rockford | $129,209 |
| 14 | Danville | $129,056 |
| 15 | Addison | $128,782 |
| 16 | Berwyn | $128,724 |
| 17 | Aurora | $128,641 |
| 18 | Tinley Park | $128,621 |
| 19 | Northbrook | $128,489 |
| 20 | St. Charles | $128,409 |
| 21 | Gurnee | $128,378 |
| 22 | Arlington Heights | $128,198 |
| 23 | Wheaton | $128,033 |
| 24 | Woodridge | $127,994 |
| 25 | Schaumburg | $127,930 |
| 26 | Buffalo Grove | $127,893 |
| 27 | Bartlett | $127,882 |
| 28 | Lake in the Hills | $127,408 |
| 29 | Collinsville | $127,387 |
| 30 | Skokie | $127,352 |
| 31 | Wheeling | $127,165 |
| 32 | Carpentersville | $127,024 |
| 33 | Oak Lawn | $126,939 |
| 34 | O'Fallon | $126,912 |
| 35 | Quincy | $126,417 |
| 36 | Algonquin | $126,417 |
| 37 | Bloomington | $126,371 |
| 38 | Carol Stream | $126,305 |
| 39 | Normal | $126,299 |
| 40 | Lombard | $126,225 |
| 41 | Cicero | $126,093 |
| 42 | Plainfield | $125,962 |
| 43 | Des Plaines | $125,938 |
| 44 | Urbana | $125,901 |
| 45 | Oswego | $125,456 |
| 46 | DeKalb | $125,355 |
| 47 | Park Ridge | $125,254 |
| 48 | Hanover Park | $125,204 |
| 49 | Glenview | $125,194 |
| 50 | Romeoville | $124,688 |
| 51 | Streamwood | $124,516 |
| 52 | Downers Grove | $124,284 |
| 53 | Belleville | $124,254 |
| 54 | Crystal Lake | $124,052 |
| 55 | Galesburg | $123,576 |
| 56 | Calumet City | $123,536 |
| 57 | Elmhurst | $123,232 |
| 58 | Carbondale | $122,017 |
| 59 | Springfield | $121,353 |
| 60 | Naperville | $118,594 |
| 61 | Chicago | $117,369 |
| 62 | Elgin | $116,323 |
| 63 | Moline | $109,451 |
| 64 | Rock Island | $107,755 |
More Illinois Salary Data
Senior / Experienced
Top earner salaries for experienced actuaries.
Compare Cities in Illinois
View all comparisons →Explore More Actuary Salary Data
Frequently Asked Questions
How much do actuaries make in Illinois in 2026?
What is the highest paying city for actuaries in Illinois?
How does Illinois actuary pay compare to the national average?
What is the entry-level actuary salary in Illinois?
How many actuaries are employed in Illinois?
Which Illinois city offers the best value for actuaries?
Written by Maria Chen, FSA, MAAA
Career Analyst
Maria has 10 years of experience in life insurance. She specializes in risk assessment and pricing strategies.
Methodology & Data Source
Statewide salary figures on this page are 2026 projections based on the Bureau of Labor Statistics Occupational Employment and Wage Statistics (OEWS) survey, May 2026 release. A 3.20% compound annual growth rate (CAGR), derived from 6-year national BLS wage trends, was applied to each metro area's reported salary to estimate current 2026 actuary compensation across Illinois. State averages are employment-weighted across 64 metro areas — larger metro areas with more actuariescontribute proportionally more to the average, producing figures that better reflect typical compensation. Individual pay varies by city, employer, certifications, and experience.
Data Sources & Methodology
Source: BLS, OEWS, 7-year dataset (–). Per-city data from annual BLS metropolitan area surveys.
2026 figures are projected from 2025 BLS data using a compound annual growth rate (CAGR) of 3.20%, derived from historical BLS wage trends for actuarys (SOC 15-2011).
Compiled and verified by Maria Chen, FSA, MAAA, a licensed actuary with 10+ years of clinical experience. · View source data at BLS.gov