Actuary Salary in Washington, DC: $149,310 (2026)
Quick Answer:A full-time actuary in Washington, DC earns a median $149,310/year (≈ $71.79/hour) in nominal terms for 2026 — projected from BLS OEWS 2025 (SOC 15-2011). Once you factor in Washington's price level (9% above national, BEA RPP 108.9), that paycheck buys what $137,128 would nationally. Nominal pay sits 4.9% below the District of Columbia state average.
Official BLS data · View source
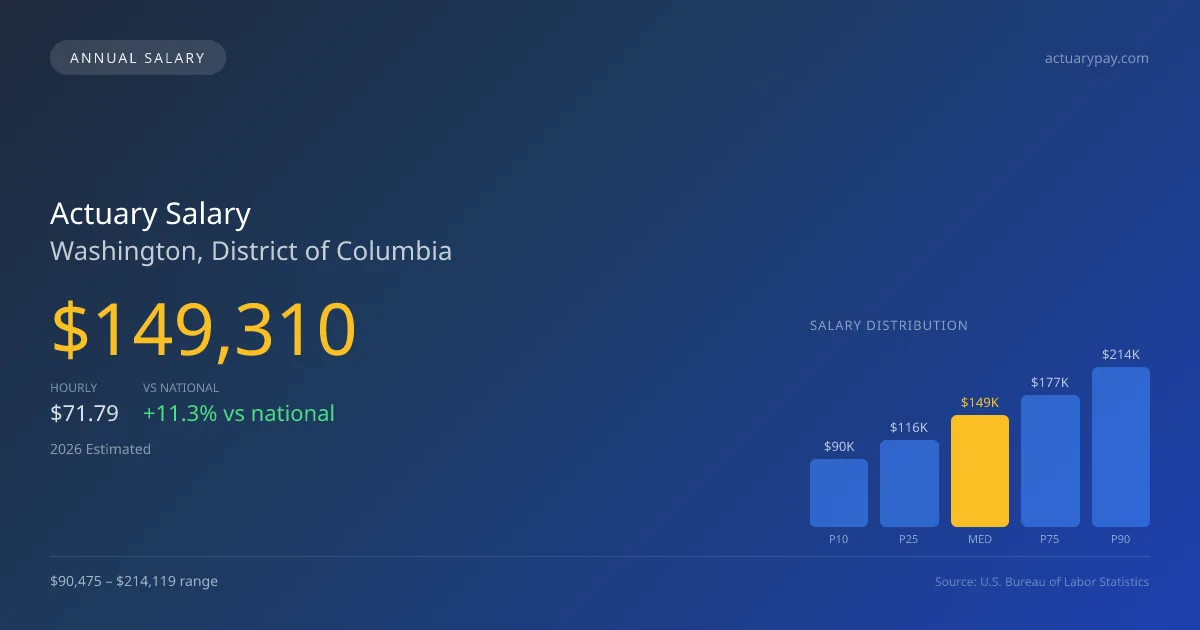
In 2026, actuaries in Washington, DC are projected to earn a median annual salary of $149,310, which is notably higher than the national median of $134,160. The salary range for this profession in the district is significant, spanning from $90,475 at the 10th percentile to $214,119 at the 90th percentile. These insights are derived from official Bureau of Labor Statistics (BLS) OEWS surveys. The robust compensation reflects the demand for actuaries in Washington's diverse job market, particularly as professionals navigate an extensive exam progression that often leads to substantial pay increments.
Salary Breakdown
| Percentile | Annual | Hourly |
|---|---|---|
| Entry Level (P10) | $90,475 | $43.50 |
| Lower Range (P25) | $115,770 | $55.66 |
| Median (P50)(typical) | $149,310 | $71.79 |
| Upper Range (P75) | $176,874 | $85.04 |
| Top Earners (P90) | $214,119 | $102.94 |
Median Salary Position
11.29% above the national average
2026 Salary Percentile Distribution in Washington
In Washington, DC, the actuary salary spread from the 10th to 90th percentile is $123,644 (2026 est.). At $149,310, the local median is 11.29% above the national median of $134,160.
Salary Calculator
At 40 hours/week in Washington: You'd be in the lower-middle range
How Washington Actuary Pay Compares
Washington median: $149,310/year (2026)
| Compared To | Median Salary | Washington Pays |
|---|---|---|
| District of Columbia Average | $157,003 | -4.90% less |
| National Average | $134,160 | +11.29% more |
Actuarys in Washington, DC earn a median of $149,310 per year (2026 est.), which is 11.29% higher than the national median of $134,160 and 4.90% below the District of Columbia state average of $157,003.
Cost-of-Living Adjusted Salary
Washington has a cost of living 8.88% above the national average.
Adjusted salary = nominal × (100 / CoL index). CoL index: 100 = national average.
Washington, DC has a cost-of-living index of 108.884 (above the national average of 100). While the nominal salary of $149,310 is competitive, the higher cost of living reduces purchasing power to an effective $137,128 — a 8.16% reduction.
Compare Purchasing Power
Select a city to see how your salary compares after cost of living
Select a city above to compare purchasing power
2019 BLS Actual
$108,090
2025 BLS Actual
$144,680
2026 Current Est.
$149,310
2019–2027 Growth
+42.6%
Salary Trajectory for Actuaries in Washington (2019–2027)
2019–2025: actual BLS OEWS data for this metro area. 2026+: CAGR 3.20% projection.
| Year | Annual Salary | Status |
|---|---|---|
| 2019 | $108,090 | Actual |
| 2020 | $123,568 | Actual |
| 2021 | $124,950 | Actual |
| 2022 | $137,710 | Actual |
| 2023 | $134,410 | Actual |
| 2024 | $137,610 | Actual |
| 2025 | $144,680 | Actual |
| 2026(current) | $149,310 | Estimated |
| 2027 | $154,088 | Projected |
Based on 7 years of BLS OEWS data for the Washington metropolitan area, the median actuary salary grew 33.9% from $108,090 (2019) to $144,680 (2025). At a 3.20% compound annual growth rate, salaries are projected to reach $154,088 by 2027 — a total increase of $45,998 (42.56%) from 2019.
Note: Historical values (2019–2025) are actual BLS OEWS figures for the Washington metropolitan area, sourced from annual Occupational Employment and Wage Statistics surveys. 2026–2026 figures are current estimates, and 2027 values are projections, calculated using a 3.20% CAGR derived from 7-year BLS historical data. Actual salaries may vary based on employer, experience, certifications, and local market conditions.
Salary by Experience Level
| Experience | Estimated Salary Range |
|---|---|
| 0-2 years (New Graduate) | $90,475 – $115,770 |
| 3-5 years (Mid Career) | $115,770 – $149,310 |
| 5+ years (Experienced) | $149,310 – $176,874 |
| 10+ years (Top Earner) | $176,874 – $214,119 |
ASA, FSA salary ranges estimated from BLS percentile data. Individual actuary compensation varies by employer, certifications, and specialization.
Actuary Job Market in Washington
With approximately 520 actuaries working in the Washington area, the job market for this profession remains strong. The cost of living index in the area is 108.884, indicating that while salaries are high, living expenses are also elevated. Major employers include life and health insurance firms such as UnitedHealth and Prudential, which are known for competitive pay packages that often incorporate bonuses and benefits for credential completion. The differences in actuary salaries can largely be attributed to the level of credentialing—those who complete multiple exams (particularly those moving from ASA to FSA) can expect substantial boosts in salary. Additionally, focusing on niche areas like property and casualty insurance or consulting can provide further opportunities for maximizing compensation in this unique DC market.
More salary data for Washington, DC:
Frequently Asked Questions
How much do actuaries make in Washington, DC in 2026?
Is Washington, DC a good place to work as a actuary?
Can actuaries make $100K in Washington?
What is the cost-of-living adjusted actuary salary in Washington?
How much does a actuary make per hour in Washington?
Related Pages
Career Resources
Written by Maria Chen, FSA, MAAA
Career Analyst
Maria has 10 years of experience in life insurance. She specializes in risk assessment and pricing strategies.
Methodology & Data Source
Salary figures on this page are 2026 projections based on the Bureau of Labor Statistics Occupational Employment and Wage Statistics (OEWS) survey, May 2026 release. The BLS reported a median annual salary of $144,680 for actuariesin the Washington metropolitan area. A 3.20% compound annual growth rate (CAGR), calculated from 6-year national BLS wage trends, was applied to project current 2026 compensation. Percentile ranges (P10–P90) represent the full salary distribution across experience levels and practice settings in this market.
Data Sources & Methodology
Source: BLS, OEWS, 6-year dataset (–). Per-city data from annual BLS metropolitan area surveys.
2026 figures are projected from 2025 BLS data using a compound annual growth rate (CAGR) of 3.20%, derived from historical BLS wage trends for actuarys (SOC 15-2011).
Compiled and verified by Maria Chen, FSA, MAAA, a licensed actuary with 10+ years of clinical experience. · View source data at BLS.gov